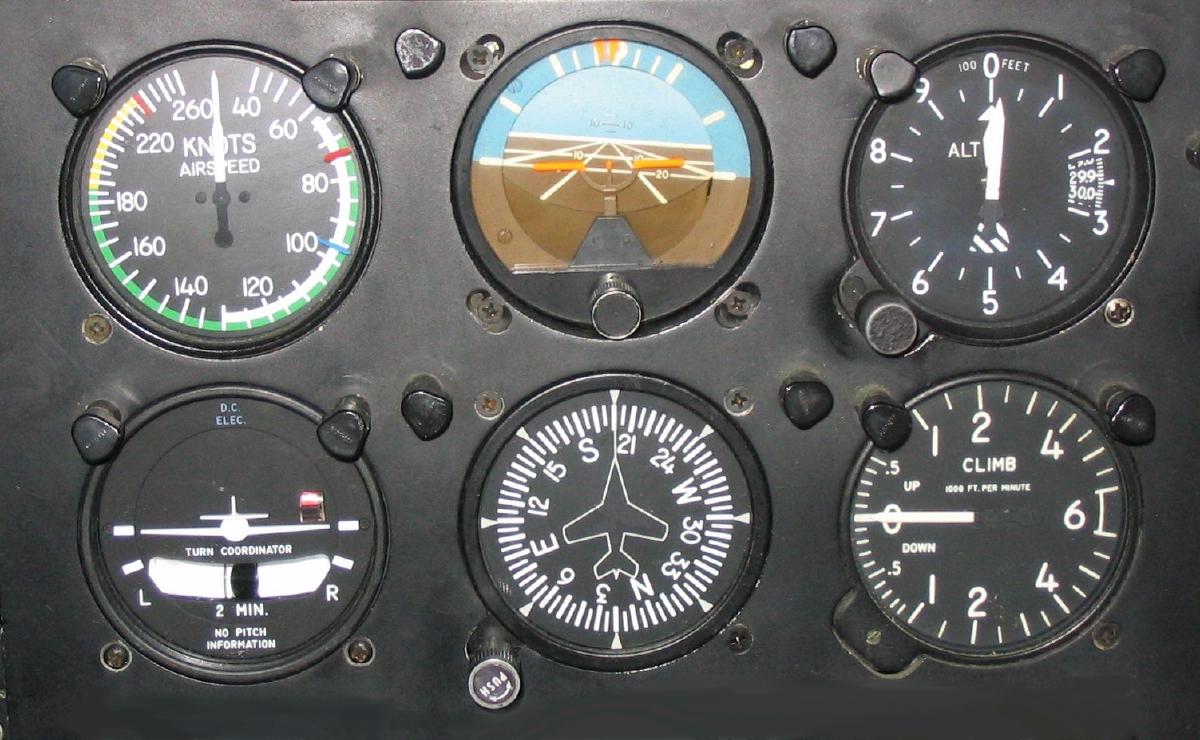
Every student pilot learning instrument flying goes through the same phase. You are trying to hold altitude, you notice you are eighty feet low, and you stare at the altimeter as though sufficient concentration will fix it.
It won’t. The altimeter is not connected to anything.
It is a readout of a result. What you actually do is set an attitude on the artificial horizon, set a power setting, and then wait for the altimeter to agree with you. The FAA has a name for this: the control and performance method of attitude instrument flying. The panel is divided into control instruments — attitude indicator, power indications, the things your hands are connected to — and performance instruments, which tell you what came out the other end. [1]
Both categories are essential. You will die without the altimeter. You just can’t fly the aircraft by adjusting it.
I have been rebuilding parts of a full-day workshop on data communication with Valerie Junk this summer, and somewhere in the middle of tearing apart the section on report design, this distinction came back to me with some force. You see, most of the dashboards I have seen in twenty-eight years are made almost entirely of performance instruments.
All gauges. No levers.
The Test Is Three Questions Long #
Here’s the thing about a number on a report: it is either something a named person can move, or it is something they can only watch.
A lever is a number someone can pull. A gauge is a number someone can read.
You can tell which is which by asking three questions about the metric, in order:
Who can change this number? Not “the business.” Not “everyone.” A named role. If the honest answer is that responsibility is distributed across four departments and a market condition, you have a gauge.
What would they actually do? A specific action someone could start on Monday morning. “Sell more” is not an action. “Reprice the bottom quartile of the range” is.
When would it visibly move? Sooner than the report refreshes.
Three answers, and you have a lever. Fewer, and you have a gauge.
That third question is the one nobody asks, and it is the one that does the most damage when it goes unexamined.
The Cadence Mismatch #
Consider a regional freight company — this is a teaching example, not a client, though I suspect several readers just thought of their own version. Their operations dashboard leads with on-time delivery percentage. Big number, top left, conditional formatting, the works. It refreshes nightly.
On-time delivery is a fine metric. It is also a gauge, and a slow one. It aggregates across depots, routes, seasons, weather, driver availability and customer behaviour. It moves over quarters. Nothing anyone does on a Tuesday shows up in it by Thursday.
But it refreshes nightly. So every morning, the operations manager opens the report and sees the number has moved. Down two tenths of a point. Up a tenth. Down again.
None of that is signal. It is variance. The metric’s true response cadence is quarterly and the display cadence is daily, and the entire gap between those two things is filled with noise that looks exactly like information.
So he chases it. He asks the depot managers why Tuesday was bad. They invent explanations, because people always do when a manager asks a question that presupposes an answer exists. Everyone spends twenty minutes a day on a number that will not respond to any of it.
Notice what happened. The report didn’t fail to drive action. It drove the wrong action, reliably, every single morning, for eighteen months.
Two clicks down, on a drill-through page nobody had opened in weeks, sat a different number: failed pickup attempts per depot per week. Named owner — the depot manager. Specific action — reschedule the route window or call the customer to fix the access problem. Response time — the following week.
That one is a lever. It was rendered in font size eight and grey.
Gauges Are Not the Enemy #
The obvious misreading of this argument is “delete your gauges,” and that would be worse than the disease.
Gauges do real work. They orient, they establish context, they answer the question is this thing still connected to reality? A report with no gauges is a report nobody believes. The altimeter earns its place precisely because you cannot fly safely without knowing your altitude — you simply don’t fly by it.
The failure mode isn’t having gauges. It’s two other things.
The first is a report made entirely of gauges. That report cannot drive action, no matter how beautifully it is built, because there is nothing on it that anyone in the room can pull.
The second is far more common: the gauge occupying the largest tile at top left while the lever is buried in a drill-through. That is a hierarchy problem, and it gives us the rule that falls out of all of this:
Size and position should follow leverage, not importance.
On-time delivery is more important than failed pickup attempts. It is closer to the thing the business actually cares about. But importance is not the same as actionability, and if you let importance drive your visual hierarchy, you will systematically bury the levers underneath the gauges. Every time.
The Sibling Question #
Back in April I wrote about Goodhart’s Law and argued that before you deploy any metric as a target, you should ask: if we optimize for this, what breaks?
The lever test is the same species of question, asked at a different moment. Goodhart’s question comes before you attach consequences to a number. This one comes when you are deciding what goes at the top left of the page.
They also fail together in an interesting way. A metric that nobody can move is a metric that will be gamed rather than pursued, because gaming is the only available response to a target you have no genuine lever for. Give someone an unmovable number and a bonus attached to it, and you have not created motivation. You have created a puzzle about reporting.
There is prior art worth acknowledging. Eric Ries separated vanity metrics from actionable ones [2]; Kaplan and Norton were distinguishing leading from lagging indicators in 1992 [3]. Neither pairing is quite this one. Vanity implies a metric meant to flatter. Leading versus lagging is about timing. The question here is narrower and more awkward: whose hands is this connected to?
Run It On Your Own Report #
Pick a report you own. List its top four or five metrics. Run the three questions on each one and mark them L or S.
I have run this exercise with rooms full of experienced practitioners and the result is consistent enough to be uncomfortable: most people find their headline KPI is a gauge. Not always — but often enough that the discovery lands with an audible silence.
The defensive reflex arrives immediately, and it is usually legitimate. Management asked for revenue on the front page. Fine. The answer is not to delete it. The answer is to demote it and pair it — keep the number, shrink it, and put the lever next to it.
But knowing which of your numbers is a lever only gets you halfway. A lever still requires a hand on it, and that hand belongs to a specific person with a calendar, a bonus structure, a reputation, and a fairly good reason to leave things exactly as they are.
That is Part 2.
Join the Conversation #
Have you found a lever buried three clicks down in your own reporting? I would be curious about the ones that stayed buried — where the gauge kept top billing because someone senior wanted it there. Find me on LinkedIn or BlueSky.
References #
[1] Instrument Flying Handbook (FAA-H-8083-15B) - Federal Aviation Administration, Chapter 6: Airplane Attitude Instrument Flying
[2] The Lean Startup - Eric Ries
[3] The Balanced Scorecard: Measures That Drive Performance - Robert Kaplan & David Norton, Harvard Business Review.
By Contributions/Meggar at the English-language Wikipedia, CC BY-SA 3.0, https://commons.wikimedia.org/w/index.php?curid=3521678